
The compute market for graphical processing units (GPUs) has evolved quickly into its own market sector. And every market sector needs a suite of indices since one will never do. Indices need to be matched with the why and how they are being used. Different indices can tell different stories. It’s critical to appreciate the differences in how indices are constructed.
In this research, we explore how indices for GPU hourly compute rental costs are being created. We will examine the important differences in definitions and methodologies for leading GPU hourly rental indices. Then we will discuss the challenges of a highly fragmented and nuanced marketplace. Compute rental indices are a necessary step in developing derivative markets for hedging compute rental risks. We will dive into the challenges for the regulation of futures and prediction market contracts based on GPU rental indices. Our bottom line is that we are in the early stages of GPU index development. We can expect new entrants designing more customized and curated compute indices. There will be methodology modifications. Creating standard, verifiable, reproducible, publicly available indices for a commodity as complex as GPU compute time is not going to be easy.
I. Three indices, three methodologies
We start with a comparison of the three indices with which derivative exchanges have chosen to affiliate to create tradable futures and prediction market contracts – namely GPU hourly rental indices provided by Ornn, Silicon Data, and Compute Desk. None of these indices have a long history, given that rental time for highly advanced GPU chips is a feature of the Artificial Intelligence (AI) revolution which we date roughly from late 2022 when OpenAI launched ChatGPT.
The indices are segmented by the Nvidia GPU chips being rented for compute use. We have the older A100 chips, the more advanced but aging H100 and H200 chips, and the newer B200 and B300 chips, and of course, more advanced chips are on the way every 12-24 months.
To highlight the differences in indices, we will focus on one chip, the relatively advanced B200 chip as an example. The lessons we will learn ring true for all the chips for which we are tracking indices.
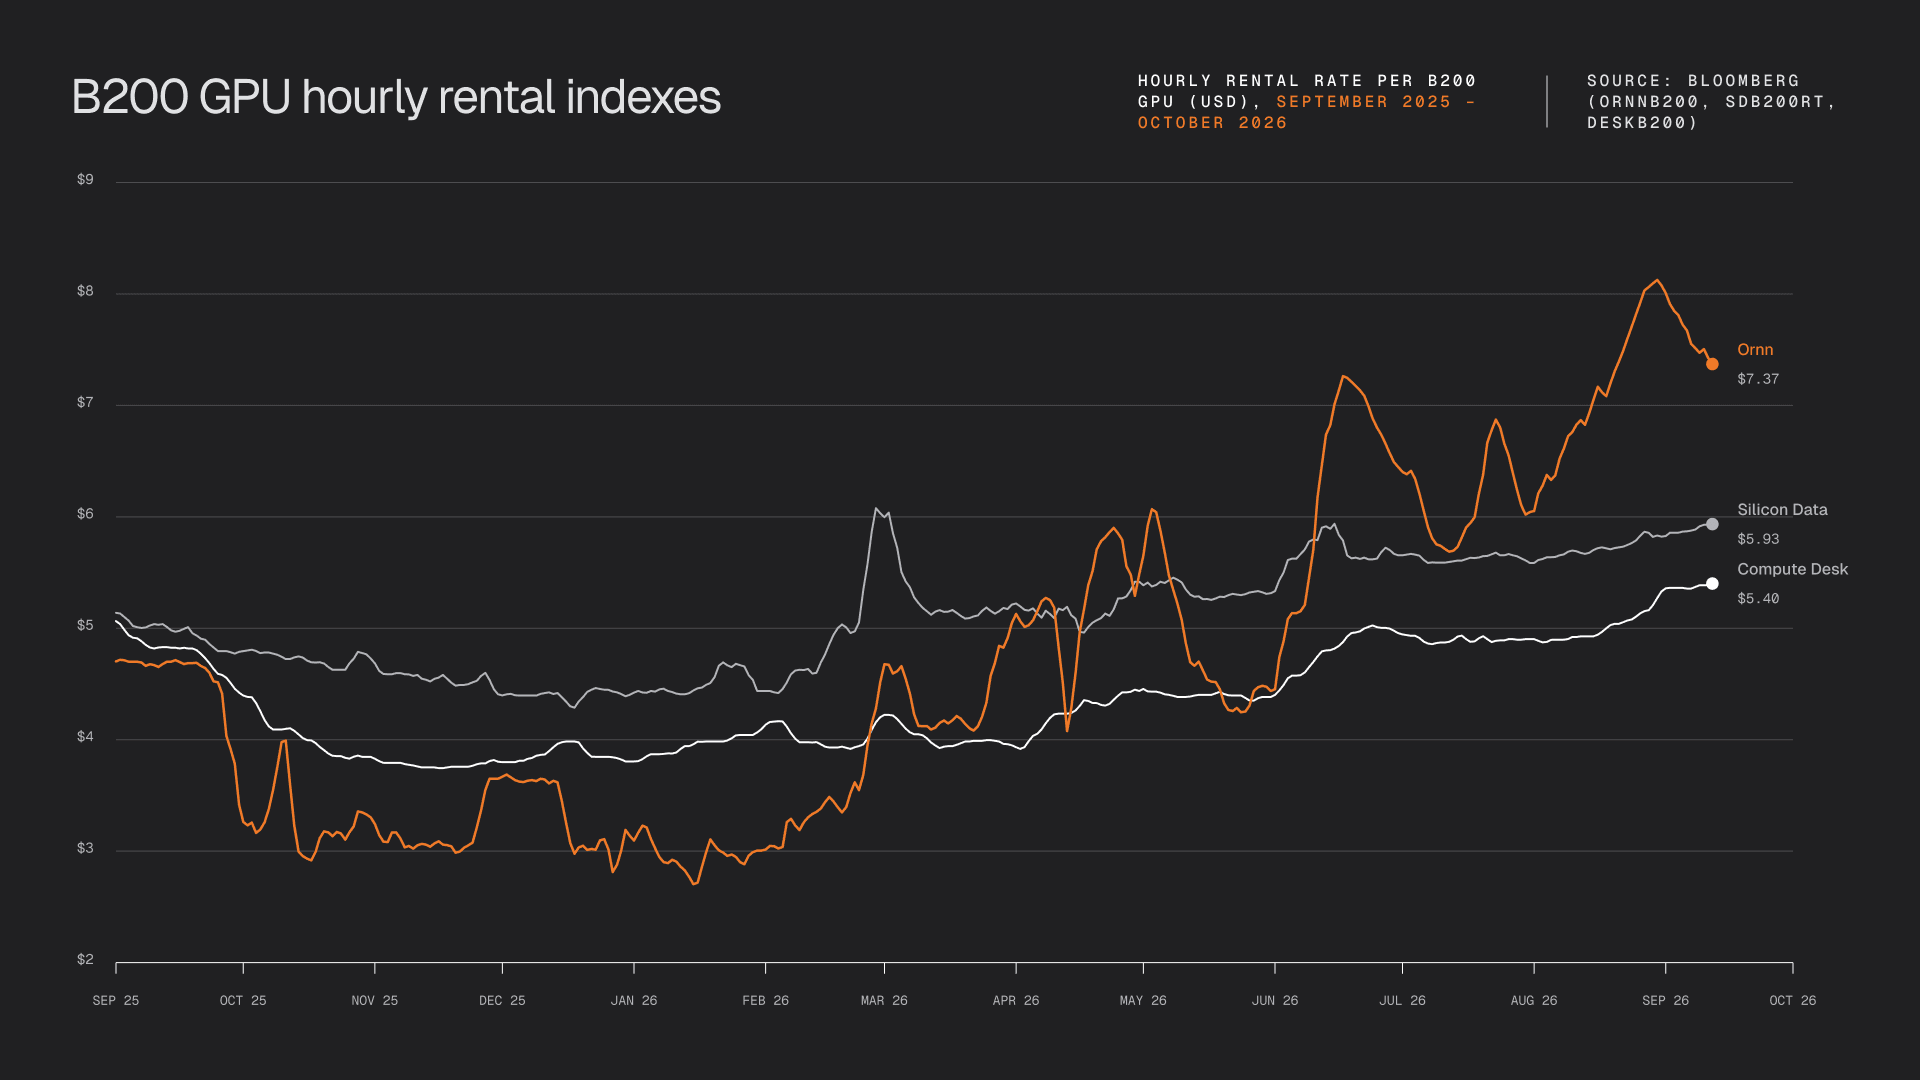
Nvidia first began shipping the B200 chip in late 2025. Daily data on B200 hourly rental prices has been generally available since September 2025. Figure 1 shows the evolution of the hourly rental rates as calculated by Ornn, Silicon Data, and Compute Desk.
A few key points to appreciate:
When Nvidia first started to ship the B200 and as the chip became available for rental use, the hourly rental price in September 2025 was close to $5/hour and similarly reported by all three of the index providers we are monitoring.
By October 2025, the indices from the providers start to diverge with Silicon Data showing higher rental costs than Compute Desk which was higher than Ornn. From November 15, through December 31, 2025, Silicon Data averaged $4.56/hour, Compute Desk was $3.80/hour, and Ornn was the lowest at $3.26/hour.
In the spring of 2026 all three of the indices started to trend higher, and by September 2026, Ornn now was reporting the highest rental prices at a monthly average of $7.25/hour, compared to Silicon Data at $5.73, and Compute Desk bringing up the rear at $5.02/hour. The apparent catalyst for the increasing chip hourly rental costs was a major increase in demand from agentic AI, a much more intense user of GPU time than basic large language models and related queries.
Finally, for our statistical observations, the volatility of the three indices varied widely. Silicon Data had the most stable index, posting a $0.21 standard deviation over the period from April 1, 2025, through October 12, 2026. Ornn was distinctly the most volatile rental index with a standard deviation of $1.19, while Compute Desk’s rental cost volatility was at $0.42, just above Silicon Data.
II. Methodology Matters
The differences in GPU rental cost patterns and the volatility of the indices comes down to their strikingly different methodologies. We will take them one by one and let the vendors speak for themselves.
Silicon Data
“Silicon Data’s GPU pricing data covers instance-level and country-level rental rates, collected every day across 30+ platforms — from hyperscalers to neo-clouds.”
Silicon Data strives for a relatively stable index where the thousands of data points are normalized across a diverse group of providers, locations, etc. Silicon Data methodology is described on its website in an article by Carmen Li, a co-founder, which we quote here:
“The challenge of building a benchmark is making heterogeneous market data comparable without stripping away its economic meaning. If records are blended without adjustment, the result no longer reflects true pricing dynamics. For instance, a short-duration spot rental in one region is not economically equivalent to a multi-year reserved contract in another. Blending them directly creates noise rather than insight.
Silicon Data uses a proprietary framework to normalize the prices of heterogeneous physical units to a standard configuration. This ensures that only comparable pricing signals are aggregated, allowing for accurate analysis across different timeframes and locations.”
Silicon Data also notes on its website that its data access is “Built for teams that need the numbers, not the charts”, and they particularly spotlight the different use cases for “Quant & Research teams, Procurement & FinOps, and Lenders & Investors”. Basically, one can subscribe to much more detailed data than the indices we are highlighting here. For example, the main indices combine data from different regions as well as different types of chip rental providers including neocloud and hyperscalers.
Ornn
Ornn has a clear focus on executed transactions. This methodology is similar to that in traditional commodity and financial markets. Commodity indices for oil, corn, wheat, etc., are strictly linked to actual prices paid. Equity and bond indices have a publicly available record of all the input prices that compose the index and methodology is public so users can replicate the index if they so choose.
From Ornn’s website:
“A benchmark rental price for a given GPU, built from anonymized records of trades that actually executed across independent providers. It is transaction-weighted, so larger trades move it more, and it excludes quotes and posted list prices, so it tracks the rate the market cleared at rather than the rate providers advertised.”
“The daily reference print is the volume-weighted average of eligible GPU rental trades over the 24-hour reference window ending 4:00 PM” ET.
Compute Desk
Compute Desk focus on a specific rental period.
“Daily reference prices for GPU compute. Each index tracks a specific GPU on a one-year reserved rental in the US, in US dollars per GPU-hour.
“The four indices on our Market Data page track US one-year reserved rental prices for H100, H200, B200 and B300 GPUs. Values are expressed in US dollars per GPU-hour. Each index uses a defined contract and reference GPU variant. Prices are adjusted to the reference contract and GPU variant using performance-based metrics, so differences in rental term or hardware performance do not distort the comparison.
The indices combine completed transactions with published neo-cloud list prices. Hyperscaler list prices are excluded. Eligible capacity is in US regions. Transaction and list-price data are normalized to the reference GPU variant and contract term. The two components are blended, with the transaction weight determined by the number of eligible trades.”
III. Appreciating the Fragmented Nature of the Compute Rental Market
In our examination of the different methodologies for GPU hourly rental indices, we tried to let each of the vendors speak for themselves through quotes selected from their websites. Now, we will shift to our interpretations and provide a summary of the differences which we think matter the most and recognize the challenges of developing a standard compute hourly rental index.
Executed transactions
Ornn is dedicated to actual, executed GPU rental transactions. The other providers include additional information, such as posted prices which may never get executed. As noted earlier, traditional commodity and financial market indices were all built exclusively on executed transactions. GPU per hour compute rental costs, however, are a new and evolving market, with many, many caveats associated with executed transactions, from size, to type of facility (neocloud or hyperscaler), to region. Creating a single, rigorous standard is next to impossible at this stage of the industry development, so it is a choice as to whether to add more pricing data from posted prices and other sources or to focus only on executed trades.
Smoothing the data
Silicon Data has the most aggressive data smoothing approach, Compute Desk data is naturally a little less volatile due to its focus on a 1-year reserved rental price. Ornn volume weights eligible executed transaction over a 24 hour period for its daily indices, but other than volume-weighting, they do the least amount of data smoothing, and it clearly shows in the heightened volatility of their indices. We make no value judgment here. Whether one wants to smooth out volatility to get a cleaner picture of the trend or whether one wants to appreciate the realized volatility that is part of the risk management challenge of being involved in real world transactions is related to the question being asked, why it is being asked, and who is asking – AI development companies, data center builders and owners, hedge funds, and so on.
Type of GPU provider
GPU providers are often categorized as either hyperscalers or neocloud, and the pricing can be different. Hyperscalers, such as Microsoft, Meta (Facebook), Alphabet (Google), Oracle and Amazon, provide massive scale, hence their name. Neoclouds are new emerging clouds who are challenging the hyperscalers. Even within neoclouds, CoreWeave and Nebius are now much larger than other neoclouds, so there are tiers within the neocloud group. Hyperscalers tend to have premium pricing due to their history of providing reliable compute in addition to other value-added services. The headline indices we are examining combine hyperscalers with neocloud providers. Some of the data providers, however, provide more detailed information – for a subscription fee – allowing researchers to subdivide the data as they wish. In many cases, going beyond the headline indices and having access to much more detailed data is going to be extremely useful.
Regions
Compute Desk is focused on the United States only, while Silicon Data and Ornn take a global approach. Similar to the type of provider, users and providers can vary dramatically from one region to the next, say from Asia to North America. And again, which index you prefer will depend on the questions one is asking about location or whether US only or global data is preferred.
Time
GPU rental comes with different tenors. One can get the compute right away for both on-demand and reservation. The main difference is that on-demand is where one can stop usage whenever one wants, whereas reservation has fixed time usage.
Naturally, prices may differ with the different time commitments. Ornn’s indices are considerably more volatile due to the influence of on-demand rentals, while Compute Desk’s focus on 1-year rentals provides a more stable price pattern.
Transparency
Traditional financial and commodity indices are public and transparent. Transparency varies among compute indices. Ornn makes detailed data available for subscribers. One can create their own sub-indices. Silicon Data uses a proprietary smoothing process. Their indices have a smoother pattern that filters out some volatility, but one will not be able to reproduce their index.
IV. Benchmarking Derivative Compute Securities: Regulatory Challenges
We chose our three index providers for this research because each of them has been selected to be used as the benchmark or reference index for derivative securities, either a futures contract or a prediction market. The Commodity Futures Trading Commission (CFTC) regulates at the US national level both futures markets and prediction markets, but they make distinctions that matter for the choice of index and the exchange offering the derivative security.
The CFTC allowed Kalshi to go live with prediction market contracts for GPU hourly rental costs back in the summer of 2026, using Ornn to provide its reference index to settle its contracts. On the futures front, CME Group (using Silicon Data), Intercontinental Exchange (ICE, using Ornn), and Nodal (using Compute Desk) planned to launch futures contracts on GPU hourly rental costs as early as October 2026, but they have been delayed by the CFTC. The reasons the CFTC delayed futures contracts and allowed prediction markets are interesting and they bear directly on the methodology for constructing the reference indices and how they will be used.
The CFTC views prediction markets and future market contracts as fundamentally different in terms of the potential risk of loss to users of these contracts, and the difference is all about leverage. As now offered in the US, and this may change, prediction markets are 100% collateralized by the user, while futures contracts may allow significant leverage. Put another way, if one opens a position in a prediction market, one has to put up the full value of the money at risk and thus knows in advance the maximum money that can be lost. With a futures contract, one can open a position based on putting up an initial margin which may be a quarter or a fifth or even less of the notional contract value. The leverage in futures contracts mean that if prices go sharply against the contract purchaser, the user can lose way more money than was deposited to open the position. Because the risk of loss is higher than the initial money deposited to open the position, the CFTC is much more deliberate in how new futures contracts are approved and allowed to launch than it is for prediction markets.
The CFTC opened a “request for comments” (recently closed) related to futures contracts on GPU hourly rental and the CFTC is specifically concerned about the appropriateness of the reference index. This is not a judgment or comment on Ornn compared to Silicon Data or Compute Desk. The fact that futures contracts may involve leverage and the possibility of losing considerably more money than initially required to open the position means that the CFTC wants to make sure the reference index measures what is claimed and cannot be easily manipulated. If Kalshi had asked for permission to launch a futures contract, which it chose not to do, then Kalshi would have been caught into the CFTC approval delays just like CME Group Intercontinental Exchange, and Nodal. Neither CME Group nor Nodal offer prediction markets, so starting with that type of contract was not an option for them. The net is that Kalshi got a head start by offering its GPU product as a prediction market, by avoiding leverage and attracting extra scrutiny by the CFTC.
V. Bottom Line
There are more than these three index providers. We picked these three to simplify our examination of the issues and to focus our attention on the indices used by derivative exchanges. But new players are coming along as we speak. This is an evolving space. New providers may well aim for niche markets to address specifically one or more of the issues we have noted as well as focus on transparency.
For the record, in a perfect world, which do not have and will not have any time soon, we would prefer indices constructed with executed transactions only, sub-divided by tenor (i.e., on demand, reservation of different durations), regional indices (i.e., US, Europe, Asia), and by type of provider (i.e., neocloud or hyperscaler). This degree of sub-categorization is not the way the GPU compute rental index providers have chosen to go with their headline indices, which are standardized only around Nvidia chips (specifically: A100, H100, H200, B200, B300, and more to come in the future). That said, each provider makes more detailed data underlying its indices available for subscription. The offerings differ, the prices differ, and some parts of the methodology remain opaque, such as proprietary smoothing or algorithmic dynamic weighting of the various inputs. Going into the data offering details is well beyond the scope of our research here, but we do not want to give the impression that one is stuck with the headline aggregated indices.
There are quite a few questions on which the headline indices can shed light and insights. We do not have the answers, but we will be doing research. A few question, just as examples:
When new more advanced chips are released do hourly rental prices decline? Not necessarily, but the older chips may see a transition in their user bases.
If emerging financial challenges for data center construction indicate that fewer data centers than planned will get built, or delayed, what happens to compute hourly rental rates? One concept is that the existing and fully installed GPU chips will become increasingly a scarce resource, and rental prices might rise.
When/If the CFTC does approve GPU rental futures contracts, how might the existence of these risk management derivatives influence the underlying rental price, especially for on-demand compared to one-year reserved rentals? We don’t have a view, however, we will be investigating this topic once futures launch.
Will the existence of futures and prediction market contracts have a similar or different influence on the stock prices of hyperscalers and neocloud providers? This question may be of more than passing interest to asset managers and hedge funds, and the answer may involve understanding the demand for agentic AI and how it evolves.
These are interesting research questions and we cannot answer them here but watch this space for more research content as our investigations into the GPU compute space continue.
Building AI or bringing GPU capacity to market? Explore Hyperbolic at https://app.hyperbolic.ai/